How It Started
Every web developer knows the Chrome DevTools Network tab intimately. It’s where we spend hours debugging API calls, inspecting payloads, and understanding how our applications communicate with the world. But after years of building web extensions and working with complex API integrations, I found myself repeatedly hitting the same limitations. The standard Network tab is powerful, but it wasn’t designed for the specific workflow of extension developers who need to rapidly iterate on API calls, track down specific payloads, and maintain a working set of frequently-accessed requests. This frustration led to building Doug Silkstone’s Network Inspector - not as a replacement for DevTools, but as an enhancement for when you need some extra oomph.Understanding the Problem
Web extension developers face unique challenges when working with network requests:The Daily Workflow Friction
- Lost context across sessions: That critical API call you were debugging yesterday? You’ll spend 5 minutes finding it again today
- Payload archaeology: Digging through hundreds of requests to find the one with specific JSON payload data
- Manual request replay: Copying curl commands or rebuilding requests from scratch to test variations
- Filter limitations: DevTools filtering is powerful, but not designed for deep payload searching
- Extension-specific debugging: Background scripts, content scripts, and popup contexts create complex request flows
The Real Cost
For developers building web extensions or integrating with third-party APIs:- Time waste: 10-15 minutes per day hunting for specific requests adds up to hours per month
- Context switching: Breaking flow to manually replay requests slows development
- Debugging overhead: Extension development already has complexity - tooling shouldn’t add more
- Knowledge loss: No way to bookmark or favorite important requests across sessions
Building the Solution
I built Network Inspector to solve my own workflow problems. Every feature exists because I personally needed it while building extensions. The goal was simple: enhance the DevTools network experience without trying to replace it. Network Inspector sits alongside your standard network tab, providing additional capabilities when you need them.Core Philosophy
Not a replacement, an enhancement. The standard DevTools network tab is excellent. Network Inspector adds specific features that extension developers need, without trying to rebuild everything from scratch. Workflow-focused. Every feature answers a specific question: “How many times have I needed to do this today?” If the answer was more than once, it became a feature. Free for the community. This tool solved my problems. Making it free means other developers can benefit from the same workflow improvements.What It Does
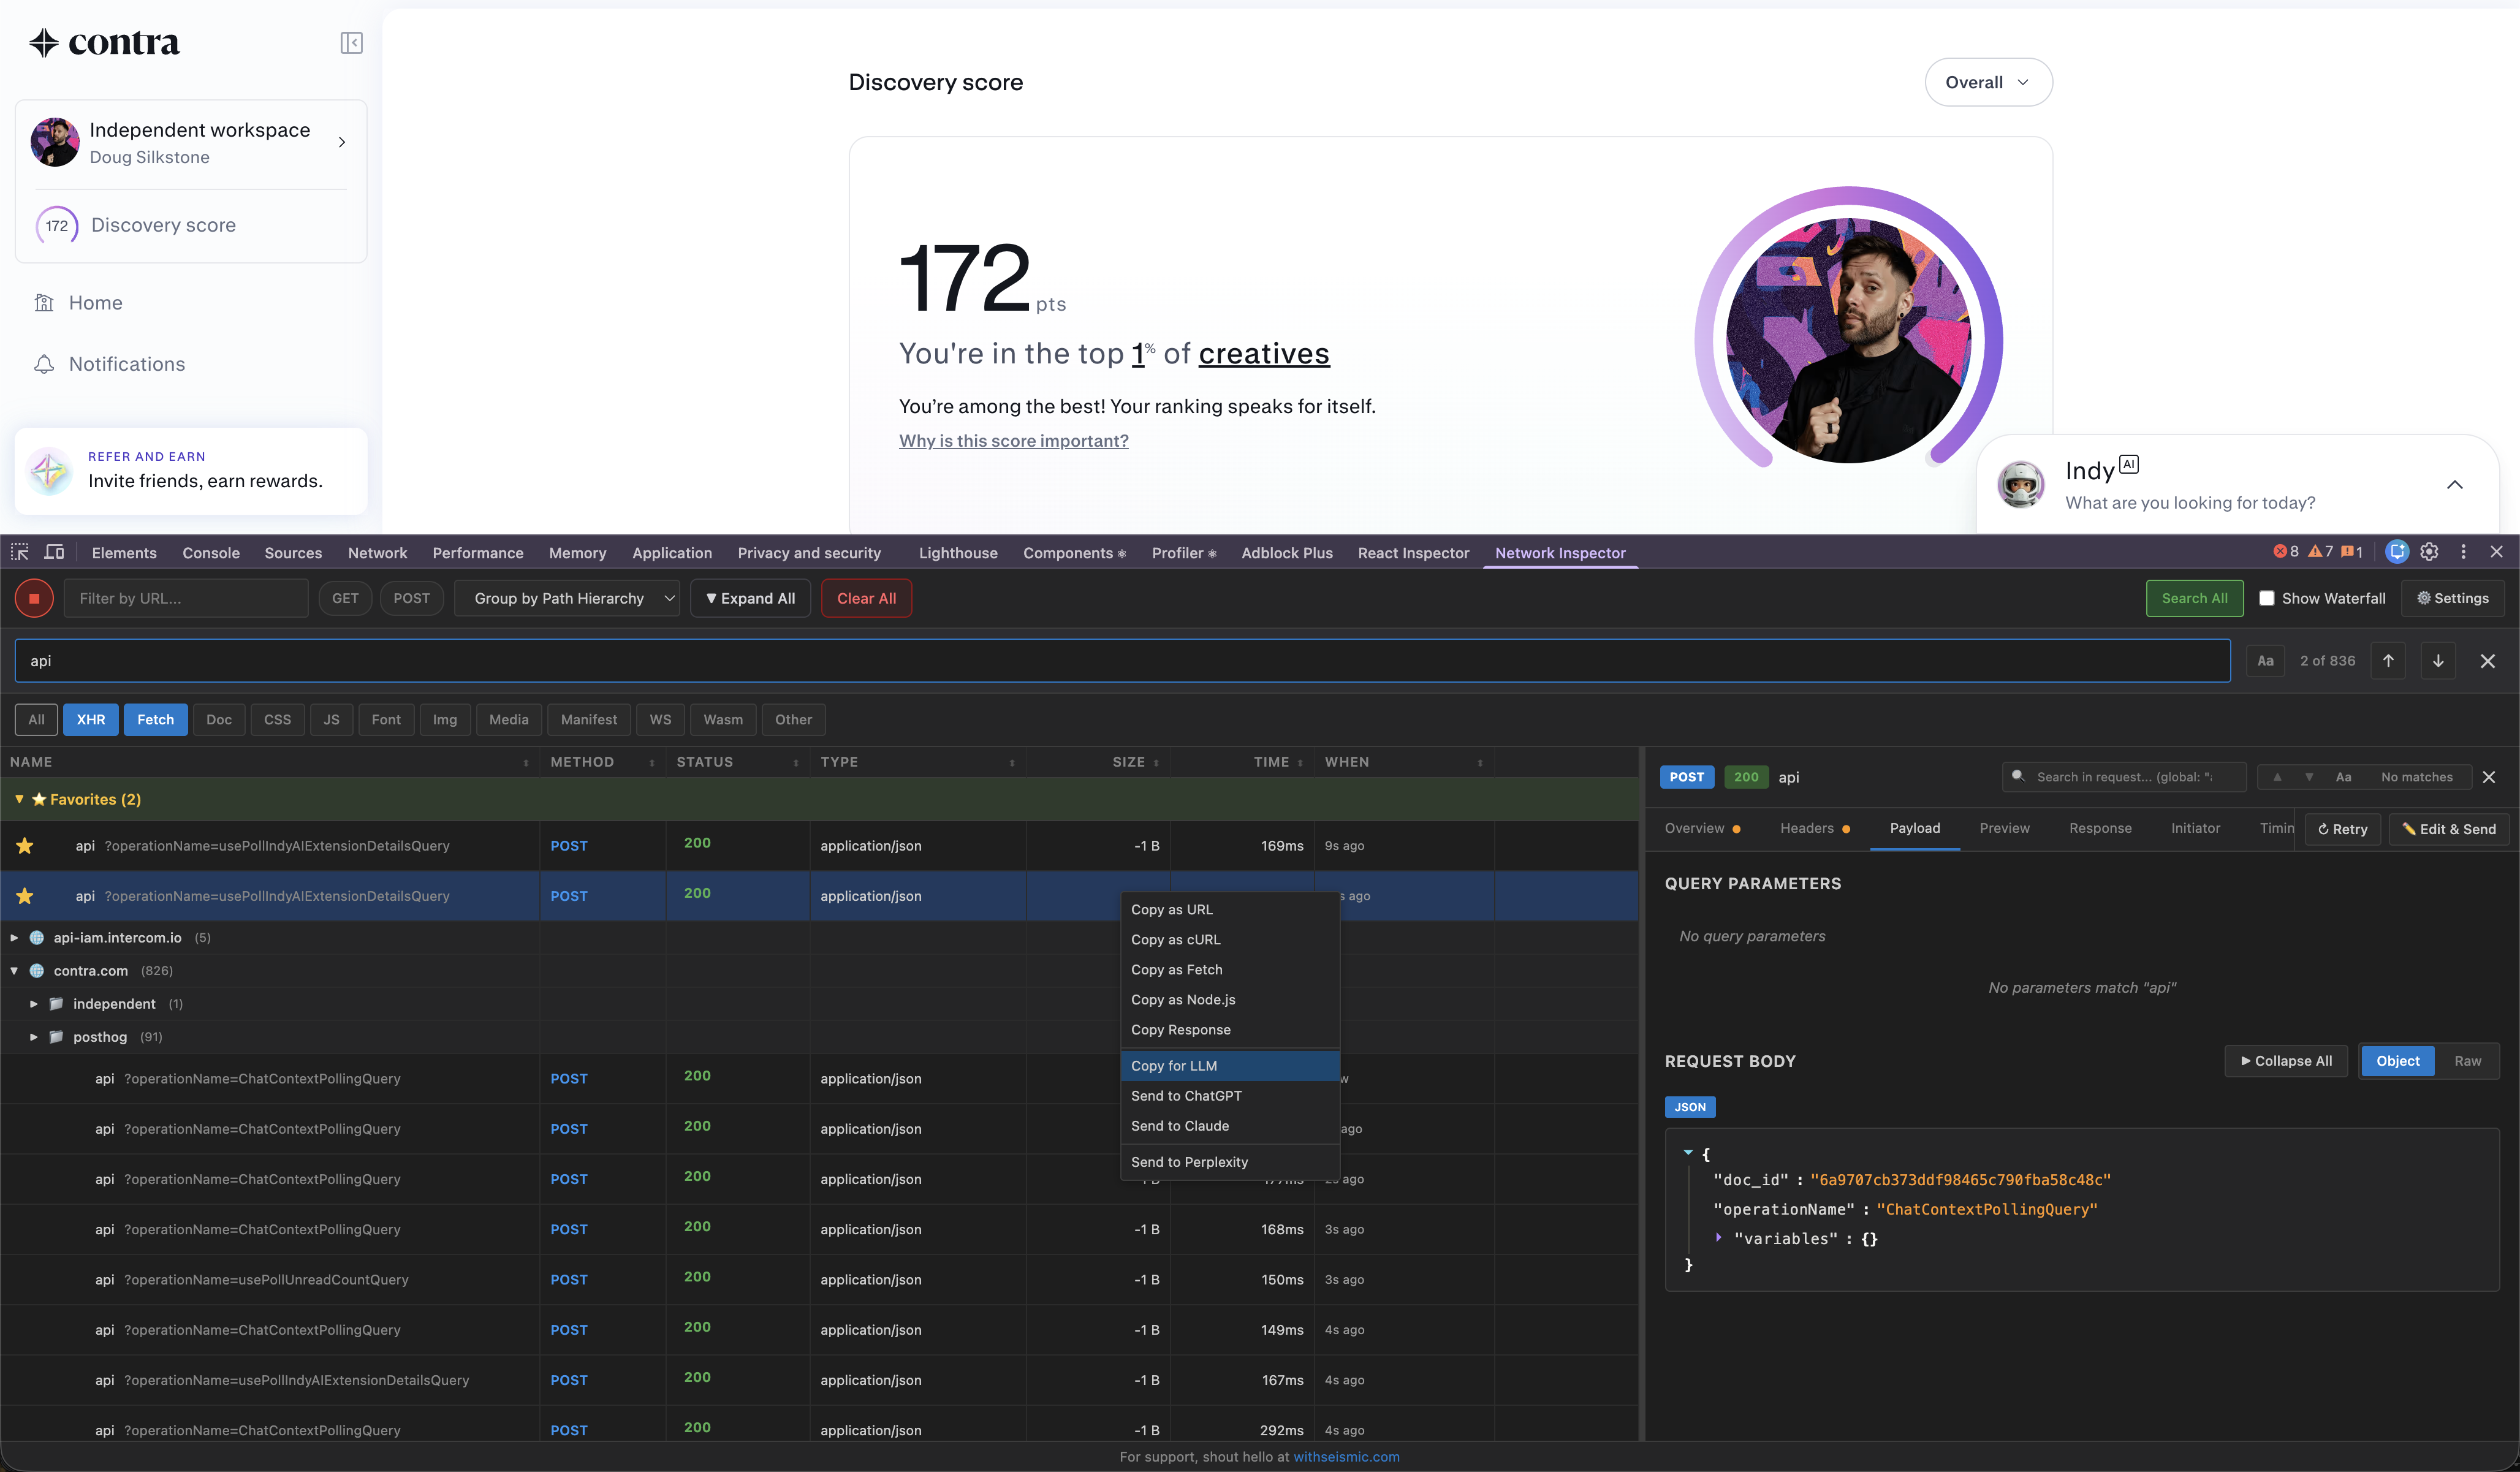
Network Inspector extends the standard network debugging experience with four key capabilities:1. Advanced Filtering & Search
Beyond basic URL filtering, Network Inspector lets you search deep into request and response payloads:- Full-text search across all payload data
- JSON path filtering for nested data
- Request/response body inspection
- Header deep-search across all requests
- Filter by method, status, type with payload awareness
2. Persistent Favorites
Save important requests across sessions:- One-click favoriting of critical API endpoints
- Persistent storage across browser restarts
- Organized favorites list for quick access
- Context preservation (headers, body, timing)
- Export/import favorites for team sharing
3. Request Replay
Send and resend requests without manual reconstruction:- One-click request replay with original headers
- Edit and resend functionality
- Multiple rapid iterations without page refresh
- Test authentication variations
- Preserve context between sends
4. Extension-Optimized UX
Designed specifically for the extension development workflow:- Background script request isolation
- Content script request tracking
- Popup lifecycle request monitoring
- Extension context awareness
- Clean interface that doesn’t fight with DevTools
The Technical Build
Network Inspector leverages Chrome’s extension APIs to enhance the network debugging experience:Architecture
Chrome DevTools Protocol- Direct access to network events
- Request/response interception
- WebSocket connection monitoring
- Resource timing data
- Background script monitoring
- Content script request tracking
- Cross-context request correlation
- Isolated world communication
- IndexedDB for favorites storage
- Chrome Storage API for preferences
- Efficient payload caching
- Export/import functionality
- Manifest V3 architecture
- Service worker background context
- React-based DevTools panel
- TypeScript for type safety
Key Technical Challenges
Cross-Context Request Tracking Extension requests span multiple contexts (background, content scripts, popups). Correlating these requests and presenting them coherently required careful architecture. Payload Search Performance Searching through large JSON payloads in real-time without blocking the UI required efficient indexing and worker thread processing. DevTools Panel Integration Creating a seamless experience within Chrome DevTools while maintaining extension isolation presented unique UX challenges.How Web Developers Use It
Use Case: API Integration Development
You’re building a Chrome extension that integrates with a third-party API:- Discovery phase: Use advanced filtering to find all requests to the API domain
- Favorite critical endpoints: Save the authentication, user data, and action endpoints
- Rapid iteration: Edit and resend requests to test different parameters
- Payload inspection: Deep search through responses to find specific data structures
- Session persistence: Return tomorrow and your favorites are still there
Use Case: Debugging Complex Extensions
Your extension makes requests from background scripts, content scripts, and popups:- Context awareness: See which requests come from which extension contexts
- Request correlation: Track request chains across contexts
- Quick replay: Resend failed requests without page refresh
- Payload archaeology: Find that one request with the specific error message
Use Case: Third-Party Integration Debugging
You’re trying to understand how a website’s API works:- Comprehensive search: Find all requests containing specific payload data
- Pattern recognition: Favorite similar requests to identify patterns
- Request templates: Save successful requests as templates for your integration
- Rapid testing: Modify and resend to understand parameter behavior
The Results
Network Inspector is now available free on the Chrome Web Store, helping web developers work more efficiently with network requests.Developer Benefits
Time Savings- 10-15 minutes saved daily on request hunting
- Instant access to frequently-used endpoints
- Faster debugging iterations
- Persistent context across sessions
- Reduced context switching
- Streamlined extension development
- Deep payload searching beyond DevTools
- Request replay without manual work
- Organized favorites for common endpoints
What I Learned
Personal frustration drives the best tools. Building for my own workflow meant every feature had clear value. No feature bloat, no “nice-to-haves” - only solutions to real daily problems. Enhancement beats replacement. I didn’t try to rebuild DevTools. Network Inspector does a few things really well and integrates with existing tools developers already know. Free tools build community. Making this free meant other developers could benefit immediately. The goal isn’t monetization - it’s improving the workflow for everyone building extensions. Developer tools need developer workflows. Understanding the specific workflow of extension development (not just web development) was critical to building useful features.Future Enhancements
Network Inspector continues to evolve based on developer feedback:- Request collections: Group related requests for complex workflows
- HAR file export: Export favorites as HAR for sharing
- Request diffing: Compare similar requests to spot differences
- Team sync: Share favorites across team members
- GraphQL awareness: Better support for GraphQL request inspection
Frequently Asked Questions
How is this different from the standard DevTools Network tab?
How is this different from the standard DevTools Network tab?
Network Inspector doesn’t replace DevTools - it enhances it. It adds advanced payload searching, persistent favorites across sessions, easy request replay, and UX optimized for extension development. Use both together.
Is this really free?
Is this really free?
Yes, completely free. I built this to solve my own workflow problems and decided to share it with the developer community. No premium tier, no paid features.
What browsers are supported?
What browsers are supported?
Currently Chrome and Chromium-based browsers (Edge, Brave, etc.). The extension uses Chrome’s DevTools Protocol which is specific to Chromium browsers.
Can I use this for regular web development or only extensions?
Can I use this for regular web development or only extensions?
Absolutely! While optimized for extension development, any developer working with network requests will benefit. API integration, debugging third-party services, or general web development all work great.
Does it impact browser performance?
Does it impact browser performance?
Network Inspector only runs when DevTools is open and only monitors when you have the panel active. Minimal performance impact, and favorites are stored locally using IndexedDB.
Can I contribute or request features?
Can I contribute or request features?
Currently focused on core stability, but open to feedback. Reach out through the Chrome Web Store support page or contact WithSeismic directly.
Is the extension open source?
Is the extension open source?
Not currently, but considering it for the future. The focus right now is on stability and user experience.
How do favorites persist across browser sessions?
How do favorites persist across browser sessions?
Favorites are stored locally using IndexedDB, so they persist across browser restarts. You can also export/import favorites to share with team members or backup.
Key Features
Advanced Payload Search
Search deep into JSON payloads across all requests
Persistent Favorites
Save critical requests across browser sessions
Request Replay
Send and resend requests with one click
Extension-Optimized
Built specifically for web extension development workflow
Innovation Highlights
- Workflow-focused design: Every feature solves a real daily problem
- Non-intrusive enhancement: Works alongside DevTools, not replacing it
- Free for community: Available to all developers at no cost
- Extension-aware: Understands background scripts, content scripts, and contexts
- Developer-built: Created by a developer for developers
Technologies Used
Chrome Extension APIs
Manifest V3, DevTools Protocol
React
DevTools panel interface
TypeScript
Type-safe development
IndexedDB
Favorites persistence
Chrome Storage API
Preferences sync
Web Workers
Payload search performance
Get Started
Install Network Inspector
Free download from the Chrome Web Store
- Open Chrome DevTools (F12 or Cmd+Option+I)
- Look for the “Network Inspector” tab
- Start browsing - requests will appear automatically
- Use the star icon to favorite important requests
- Click any request to replay or inspect payloads
- Use the search bar for deep payload filtering
- Favorite your authentication endpoints first
- Use payload search to find specific API response structures
- Replay requests to test without page refresh
- Export favorites to share with your team